Wondering how to sell your home in less time and for more money?
Don’t believe everything you see on HGTV.
Here are four common home seller myths that we’ve debunked for you.
#1) Don’t renovate everything
In today’s market, sellers have the upper hand and buyers are competing over a shortage of inventory. While it’s advantageous for your home to stand out, you can likely get a great offer by making smart, minimal repairs.
Work with your Rector Hayden Agent to determine what changes they’d recommend and see if they agree that you could focus on low-cost upgrades like new light fixtures, fresh paint, replaced hardware, and some fresh spring landscaping.
#2) Don’t “list high”
Some sellers, especially those who aren’t in a hurry to move, fight to list their home at a price higher than the fair market value. Their idea is that by listing high, they may snag a high-bidding buyer — and if they don’t, they can simply lower the price later on.
This is a dangerous plan for a few reasons:
Buyers and their agents are unlikely to overbid on a home that’s being sold for much more than the one down the block.
Homes get the most attention in their first two weeks on the market. When a buyer sees that a home has been on the market for a long time, they will either think that there is something wrong with the home or that it is listed for too high a price.
#3) Don’t sell on your own
The most common reason to sell a home “For Sale by Owner,” or FSBO, is to avoid paying a commission for a real estate agent. While we understand that it can be tough to part with any money from your hard-earned home sale, the reality is that sellers who use a Realtor end up earning more on their home sale, even when the commission is considered.
In 2018, the median selling price of a FSBO home in the U.S. was $185,000, while the median selling price of an agent-assisted home was $245,000. This large gap may be why the National Association of REALTORS® reports that FSBO sellers have dwindled to their lowest number in more than 35 years.
In short, the act of listing a home for a fair price is best handled by a true market expert who has deep insights on your community, recent sales, housing trends and more.
#4) Don’t sell using a “retail price” model
It’s interesting to see that homes priced at a round number price point — like $150,000 or $400,000 — often sell faster than homes listed at $149,000 or $399,000.
Why? It’s really a matter of buyer exposure to online listings. Today’s homebuyers mostly shop online, and they enter in search parameters based on price. If you list your home at $299,000 instead of $300,000, buyers who are searching between $300,000-$350,000 won’t end up seeing your property.
That small pricing change can make a massive difference when it comes to online exposure. Homes with round number pricing showed up in search results 58 percent more than those that were listed at a “discount” price.
What more tips for buying and selling in the Central Kentucky Market? Get in touch with your Rector Hayden Realtor or join our eNewsletter mailing list!
According to the National Association of REALTORS® (NAR), nearly 70 percent of homeowners over the age of 65 have paid off their mortgage, allowing them more options than younger homeowners.
With equity built up, the ability to sell for a profit is more likely for this demographic, who can then choose to spend their earnings however they choose. Here are five reasons you should consider downsizing your home this year.
1. Buy a smaller home with cash
Some homeowners will find that by downsizing, they can earn enough to buy a less expensive home in cash, and end up mortgage-free in a new abode. NAR says this is a very common route for those nearing retirement. Last year, homeowners between ages 55 and 74 who sold their home for a median price of $250,000 went on to purchase a home that was worth a median price of around $215,000.
2. Less time and money spent on upkeep
Larger family homes can take up tens of hours a week to keep up and cost more to cool in the summer and heat in the winter. Those who raised families may find that the three-story home they needed in the past is impractical now. NAR’s data supports this, showing that the median size home purchased by those over the age of 55 was between 1,800 and 1,930 square feet. This is a major downsizing from the age group of 35-44 years old, whose median home purchase size was 2,600 square feet.
3. Embrace the now
Many homeowners will find that their four bedroom split level was great for raising a big family, but now they tend to use their home for weekend visitors and casual get-togethers. The right home for this new lifestyle may be an open floor plan that includes guest quarters and attached bathrooms instead of many smaller bedrooms and bathrooms. Last year, NAR found that homeowners over the age of 55 had a median of three bedrooms and two full bathrooms. Great rooms also tend to replace living rooms and dining rooms — and larger, eat-in kitchens are common to save space and keep the floor plan open.
4. Look forward
Last year, NAR reported that 13 percent of buyers over the age of 50 purchased senior-friendly homes or units in active senior communities. In many cases, then, this age group is not only planning for the “now,” they are also planning for the future. One-level homes with open floor plans, larger rooms and wider hallways prove to be great not only for entertaining guests, but they also will be wheelchair and senior accessible in the future.
5. Gain flexibility
Last, and perhaps most importantly, it’s finally your time to choose. By selling your home, you can regain the flexibility you gave up as you pursued your career and family aspirations. Many approaching retirement in Lexington and Central Kentucky are looking at a downtown condo and a summer rental out of state. Others are looking at townhomes with modern conveniences and a homeowner’s association that handles basic yard and sidewalk maintenance. Still others are wondering if it’s time to retire full-time to the lake home that has been a precious summer escape.
Now, unlike any time previously, you can make the choice that best suits you, and no one else!
WASHINGTON (October 20, 2016) — Existing-home sales rebounded strongly in September and were propelled by sales from first-time buyers reaching a 34 percent share, which is a high not seen in over four years, according to the National Association of Realtors®. All major regions saw an increase in closings last month, and distressed sales fell to a new low of 4 percent of the market.
Total existing-home sales 1, which are completed transactions that include single-family homes, townhomes, condominiums and co-ops, hiked 3.2 percent to a seasonally adjusted annual rate of 5.47 million in September from a downwardly revised 5.30 million in August. After last month’s gain, sales are at their highest pace since June (5.57 million) and are 0.6 percent above a year ago (5.44 million).
Lawrence Yun, NAR chief economist, says the two-month slump in existing sales reversed course convincingly in September. “The home search over the past several months for a lot of prospective buyers, and especially for first-time buyers, took longer than usual because of the competition for the minimal amount of homes for sale,” he said. “Most families and move-up buyers look to close before the new school year starts. Their diminishing presence from the market towards the end of summer created more opportunities for aspiring first-time homeowners to buy last month.”
The median existing-home price 2 for all housing types in September was $234,200, up 5.6 percent from September 2015 ($221,700). September’s price increase marks the 55thconsecutive month of year-over-year gains.
Total housing inventory 3 at the end of September rose 1.5 percent to 2.04 million existing homes available for sale, but is still 6.8 percent lower than a year ago (2.19 million) and has now fallen year-over-year for 16 straight months. Unsold inventory is at a 4.5-month supply at the current sales pace, which is down from 4.6 months in August.
“Inventory has been extremely tight all year and is unlikely to improve now that the seasonal decline in listings is about to kick in,” added Yun. “Unfortunately, there won’t be much relief from new home construction, which continues to be grossly inadequate in relation to demand.”
Matching the highest share since July 2012, first-time buyers were 34 percent of sales in September, which is up from 31 percent in August and 29 percent a year ago. First-time buyers represented 30 percent of sales in all of 2015.
“There’s hope the leap in sales to first-time buyers can stick through the rest of the year and into next spring,” explained Yun. “The market fundamentals — primarily consistent job gains and affordable mortgage rates — are there for the steady rise in first-timers needed to finally reverse the decline in the homeownership rate.”
On the topic of first-time buyers, NAR President Tom Salomone, broker-owner of Real Estate II Inc. in Coral Springs, Florida said government-sponsored enterprises Fannie Mae and Freddie Mac have a duty to ensure there’s access to mortgage credit for creditworthy borrowers wanting to buy a home.
“Unfortunately, overly burdensome fees at the GSEs are making homeownership difficult for moderate-income buyers. Fannie and Freddie can reduce the cost of borrowing while still protecting taxpayers, and we’re hopeful they’ll take these steps to ensure prospective buyers are able to enter the market,” he said.
According to Freddie Mac, the average commitment rate(link is external) for a 30-year, conventional, fixed-rate mortgage inched up in September for the first time since March, rising to 3.46 percent from 3.44 percent in August. The average commitment rate for all of 2015 was 3.85 percent.
Distressed sales 4 — foreclosures and short sales — fell to a new low of 4 percent in September (since NAR began tracking in October 2008), down from 5 percent in August and 7 percent a year ago. Three percent of September sales were foreclosures and 1 percent were short sales. Foreclosures sold for an average discount of 15 percent below market value in September (12 percent in August), while short sales were discounted 11 percent (14 percent in August).
Properties typically stayed on the market for 39 days in September, up from 36 days in August but down considerably from a year ago (49 days). Short sales were on the market the longest at a median of 118 days in September, while foreclosures sold in 67 days and non-distressed homes took 38 days. Forty-four percent of homes sold in September were on the market for less than a month.
Inventory data from Realtor.com®(link is external) reveals that the metropolitan statistical areas where listings stayed on the market the shortest amount of time in September were San Jose-Sunnyvale-Santa Clara, Calif., 34 days; San Francisco-Oakland-Hayward, Calif., 35 days; Seattle-Tacoma-Bellevue, Wash., 38 days; and Denver-Aurora-Lakewood, Colo., and Salt Lake City, Utah, both at 39 days.
All-cash sales were 21 percent of transactions in September, down from 22 percent in August and 24 percent a year ago. Individual investors, who account for many cash sales, purchased 14 percent of homes in September, up from 13 percent both in August and a year ago. Sixty-five percent of investors paid in cash in September.
Single-family and Condo/Co-op Sales
Single-family home sales increased 4.1 percent to a seasonally adjusted annual rate of 4.86 million in September from 4.67 million in August, and are now 0.6 percent above the 4.83 million pace a year ago. The median existing single-family home price was $235,700 in September, up 5.6 percent from September 2015.
Existing condominium and co-op sales declined 3.2 percent to a seasonally adjusted annual rate of 610,000 units in September from 630,000 in August, and are unchanged from a year ago. The median existing condo price was $222,100 in September, which is 6.1 percent above a year ago.
Regional Breakdown
September existing-home sales in the Northeast leapt 5.7 percent to an annual rate of 740,000, which is unchanged from a year ago. The median price in the Northeast was $261,600, which is 2.1 percent above September 2015.
In the Midwest, existing-home sales grew 3.9 percent to an annual rate of 1.32 million in September, and are now 2.3 percent above a year ago. The median price in the Midwest was $184,500, up 5.9 percent from a year ago.
Existing-home sales in the South in September ticked up 0.9 percent to an annual rate of 2.16 million, but are still 0.9 percent below September 2015. The median price in the South was $204,000, up 6.6 percent from a year ago.
Existing-home sales in the West jumped 5.0 percent to an annual rate of 1.25 million in September, and are now 1.6 percent higher than a year ago. The median price in the West was $345,400, up 8.1 percent from September 2015.
The National Association of Realtors®, “The Voice for Real Estate,” is America’s largest trade association, representing 1.1 million members involved in all aspects of the residential and commercial real estate industries.
# # #
NOTE: For local information, please contact the local association of Realtors® for data from local multiple listing services. Local MLS data is the most accurate source of sales and price information in specific areas, although there may be differences in reporting methodology.
1 Existing-home sales, which include single-family, townhomes, condominiums and co-ops, are based on transaction closings from Multiple Listing Services. Changes in sales trends outside of MLSs are not captured in the monthly series. NAR rebenchmarks home sales periodically using other sources to assess overall home sales trends, including sales not reported by MLSs.
Existing-home sales, based on closings, differ from the U.S. Census Bureau’s series on new single-family home sales, which are based on contracts or the acceptance of a deposit. Because of these differences, it is not uncommon for each series to move in different directions in the same month. In addition, existing-home sales, which account for more than 90 percent of total home sales, are based on a much larger data sample — about 40 percent of multiple listing service data each month — and typically are not subject to large prior-month revisions.
The annual rate for a particular month represents what the total number of actual sales for a year would be if the relative pace for that month were maintained for 12 consecutive months. Seasonally adjusted annual rates are used in reporting monthly data to factor out seasonal variations in resale activity. For example, home sales volume is normally higher in the summer than in the winter, primarily because of differences in the weather and family buying patterns. However, seasonal factors cannot compensate for abnormal weather patterns.
Single-family data collection began monthly in 1968, while condo data collection began quarterly in 1981; the series were combined in 1999 when monthly collection of condo data began. Prior to this period, single-family homes accounted for more than nine out of 10 purchases. Historic comparisons for total home sales prior to 1999 are based on monthly single-family sales, combined with the corresponding quarterly sales rate for condos.
2 The median price is where half sold for more and half sold for less; medians are more typical of market conditions than average prices, which are skewed higher by a relatively small share of upper-end transactions. The only valid comparisons for median prices are with the same period a year earlier due to seasonality in buying patterns. Month-to-month comparisons do not compensate for seasonal changes, especially for the timing of family buying patterns. Changes in the composition of sales can distort median price data. Year-ago median and mean prices sometimes are revised in an automated process if additional data is received.
The national median condo/co-op price often is higher than the median single-family home price because condos are concentrated in higher-cost housing markets. However, in a given area, single-family homes typically sell for more than condos as seen in NAR’s quarterly metro area price reports.
3 Total inventory and month’s supply data are available back through 1999, while single-family inventory and month’s supply are available back to 1982 (prior to 1999, single-family sales accounted for more than 90 percent of transactions and condos were measured only on a quarterly basis).
4 Distressed sales (foreclosures and short sales), days on market, first-time buyers, all-cash transactions and investors are from a monthly survey for the NAR’s Realtors® Confidence Index, posted at Realtor.org.
NOTE: NAR’s Pending Home Sales Index for September will be released October 27, NAR’s 2016 Profile of Home Buyers and Sellers is scheduled for October 31, and Existing-Home Sales for October will be released November 22; release times are 10:00 a.m. ET
Congratulations to the 6 agents to earn SRES Designations: Patty Adams, Laura Hayden, Alma Hopkins, Lura Justice, Sue Napier, & Larry Newsome on receiving the Senior Real Estate Specialist (SRES) designation.
REALTORS® with this designation are trained to “profitably and ethically serve the real estate needs of clients age 50 and older.”
Patty Adams, originally from Lancaster, KY, has lived in Lexington for all of her adult life. She has over 12 years of experience. Prior to becoming a Realtor, Patty worked in a 15 year career at Kentucky Utilities in IT Support.
Laura Hayden, a Lexington native, who has been a full time licensed Realtor with Rector-Hayden, Realtors, for close to 18 years. Laura, consistently a top producer and RHR’s 2015 top Individual Agent, has added SRES (Senior Real Estate Specialist) to her list of designations (ABR, GRI) to better serve her clients.
Lura Justice has lived in the Lexington area for 25 years. She has more than 16 years of real estate experience. Lura has received her ABR, CRS, ePRO, MRP and Associate Broker designations. Prior to becoming a Realtor, she received a Bachelor of Arts degree in Gerontology and a Masters in Interior Design both from the University of Kentucky.
Alma Hopkins was born and raised in the Lexington area. She has 40 years of experience with over 28 years at Rector Hayden Realtors. Alma, also has her ABR, CRS, GRI and CNHS designations as well as Broker Associate.
Sue Napier is originally from South Norwalk, CT and has lived in the Lexington area for over 15 years. Sue has 12 years of experience. She has also received her ABR, ePRO and CREN designations and specializes in residential and farm properties.
Larry Newsome has lived in the Frankfort area for over 26 years. Larry graduated from Eastern Kentucky University with a MBA in Real Estate and BBA in Marketing. He has prior experience as an owner and Broker of 2 separate real estate companies for 15 years, under-writer for 6 years and has been self-employed with LN Appraisal Services.
The SRES Designation – Seniors Real Estate Specialist Designation – is an official designation/certification provided through the National Association of REALTORS®.
“The SRES designees, like myself, are REALTORS qualified to address the needs of home buyers and sellers age 50+; that have demonstrated the necessary knowledge and expertise to counsel clients age 50+ through major financial and lifestyle transition in relocating, refinancing or selling the Family home.” -Tom Thomas, another Rector Hayden SRES Designee
Whether working with a buyer or seller, many agents rely on comparative market analysis to determine a home’s true market value. Performing these analyses can be time consuming and tricky – unless you use some of the great tools National Association of REALTORS provides for you! NAR provides the REALTORS PROPERTY RESOURCE website. It is an online estimate, valuation, and comparison tool for licensed active agents to utilize.
Comprehensive data, powerful analytics, and dynamic reports for each of NAR’s constituencies – Only available to REALTORS®. No third party or public access…guaranteed! The only way a non-REALTOR® has access to the data in RPR is through an RPR report that has been created, branded and sent by you, a licensed agent. – From the RPR Blog
To all LBAR agents (Lexington-Bluegrass Association of REALTORS) and more than likely all members of NAR, you have access to an online valuation system called RPR for free as part of your dues.
Lbar provides a shortcut to the website for you, or you can begin by going to www.narrpr.com
Log in to www.lbar.com as normal
Find the grey boxes with tools in them and search for the MEMBERS Box
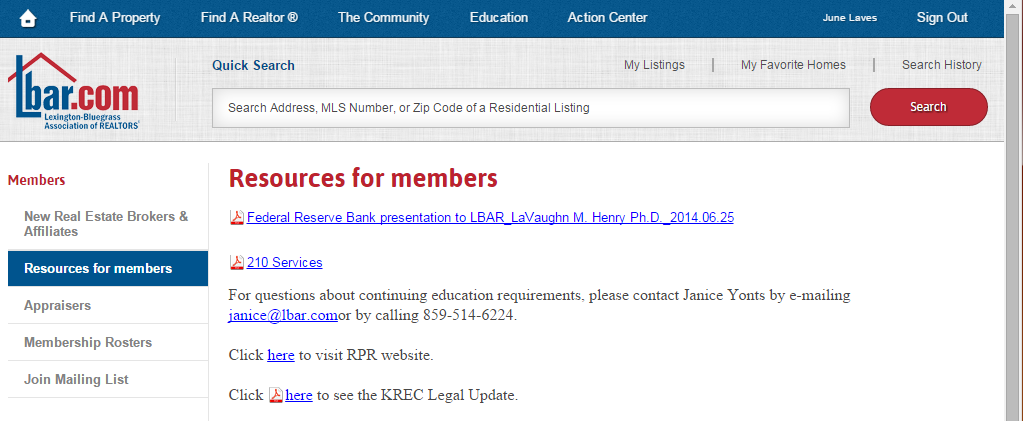
Click on Resources for Members
You should end up with the following options (click to view larger):
Then click on the link for the RPR website!
If this is your first time using the RPR website, you’ll need to create an account. You’ll need your NRDS number and contact info to get started. You can flesh out the customization options by uploading the RHR Logo and your headshot. (You can grab our logo via info.rhr.com).
We’ve put together a great resource guide for getting started with RPR – See the PDF here through our ISSUU account.